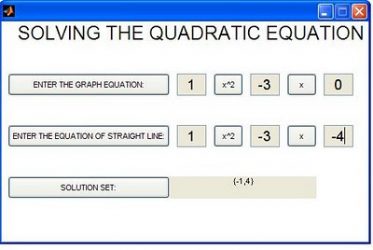
این مثال ساده برای حل معالات دوگانه است .برای حل مسائل معادلات درجه دو می باشد.اساسا دراین قسمت بیشتر بر روی رابط گرافیکی وگراف تمرکز کرده است.
علاوه بر آن پیچیدگی محاسبات را با استفاده از دستورات Texas (Texas-
Instruments-TI-83-Graphing-Calculator)
محاسبه خواهیم کرد .
| function quad_eqn() %Solving the quadratic equation by graphical method %Quadratic equation is split into two representing two equations %parabola and a straight line. %The x-co-ordinates of the points of intersection of the parabola and the %straight line will give the roots of the given quadratic equation. clear all; %global to the functions inside parabola() global e1 e2 e3 g1 g2 g3 sol; figure(‘units’,’pixels’,’position’,[200 300 500 300],’menubar’,’none’,’numbertitle’,’off’,’resize’,’off’,’color’,’w’); title(‘SOLVING THE QUADRATIC EQUATION’,’fontsize’,20,’fontname’,’Time New Roman’,’color’,’k’); axis off; uicontrol(‘style’,’push’,’units’,’pixel’,’position’,[10,200,220,30],’string’,’ENTER THE GRAPH EQUATION:’); uicontrol(‘style’,’push’,’units’,’pixel’,’position’,[10,130,220,30],’string’,’ENTER THE EQUATION OF STRAIGHT LINE:’); sol=uicontrol(‘style’,’push’,’units’,’pixel’,’position’,[10,60,220,30],’string’,’SOLUTION SET:’); set(sol,’Visible’,’off’); %Equation of a graph uicontrol(‘style’,’edit’,’units’,’pixel’,’position’,[240,200,40,30],’fontsize’,14,’callback’,{@graphx2}); uicontrol(‘style’,’push’,’units’,’pixel’,’position’,[290,200,40,30],’string’,’x^2′); uicontrol(‘style’,’edit’,’units’,’pixel’,’position’,[340,200,40,30],’fontsize’,14,’callback’,{@graphx}); uicontrol(‘style’,’push’,’units’,’pixel’,’position’,[390,200,40,30],’string’,’x’); uicontrol(‘style’,’edit’,’units’,’pixel’,’position’,[440,200,40,30],’fontsize’,14,’callback’,{@graphc}); %Equation to solve: %Provide the input in each text box. %If the co-efficient of x not present then give the value as 0. uicontrol(‘style’,’edit’,’units’,’pixel’,’position’,[240,130,40,30],’fontsize’,14,’callback’,{@equx2}); uicontrol(‘style’,’push’,’units’,’pixel’,’position’,[290,130,40,30],’string’,’x^2′); uicontrol(‘style’,’edit’,’units’,’pixel’,’position’,[340,130,40,30],’fontsize’,14,’callback’,{@equx}); uicontrol(‘style’,’push’,’units’,’pixel’,’position’,[390,130,40,30],’string’,’x’); uicontrol(‘style’,’edit’,’units’,’pixel’,’position’,[440,130,40,30],’fontsize’,14,’callback’,{@equc}); function graphx2(source,event) g1=get(source,’string’); end function graphx(source,event) g2=get(source,’string’); end function graphc(source,event) g3=get(source,’string’); end function equx2(source,event) e1=get(source,’string’); end function equx(source,event) e2=get(source,’string’); end function equc(source,event) e3=get(source,’string’); solve(); end function solve() %Initialize the variables inc=0; %preallocate the memory p=zeros(1,4); r=zeros(1,4); try %Convert the string into number gr1=str2double(g1); gr2=str2double(g2); gr3=str2double(g3); eq1=str2double(e1); eq2=str2double(e2); eq3=str2double(e3); %Solving the two equations a=gr1-eq1; b=gr2-eq2; c=gr3-eq3; x=-10:10; temp=power(x,2); y=(gr1*temp)+(gr2*x)+gr3;%ax^2+bx+c z=(a*temp)+(b*x)+c; catch display(‘ERROR OCCURRED’); close all hidden; return end for i=1:21 if(y(i)==z(i)) inc=inc+1; p(inc)=y(i); r(inc)=x(i); end end set(sol,’Visible’,’on’); if(inc==2) n1=num2str(r(1)); n2=num2str(r(2)); solset=strcat(‘{‘,n1,’,’,n2,’}’); uicontrol(‘style’,’text’,’units’,’pixel’,’position’,[230,60,200,30],’String’,solset); else uicontrol(‘style’,’text’,’units’,’pixel’,’position’,[230,60,200,30],’String’,’none’); end figure(‘units’,’pixels’,’position’,[100 50 1000 650],’menubar’,’none’,’numbertitle’,’off’,’resize’,’off’,’color’,’w’); plot(x,y); hold on plot(x,z); xlabel(‘X- axis’); ylabel(‘Y-axis’); title(‘GRAPH’,’fontsize’,14,’color’,’k’); if(inc>0) for i=1:inc; n1=num2str(r(i)); n2=num2str(p(i)); point1=strcat(‘(‘,n1,’,’,n2,’)’); text(r(i),p(i),point1); end end end end |


پاسخ دادن